2005 Coastal Color Infrared Orthophotography
Description
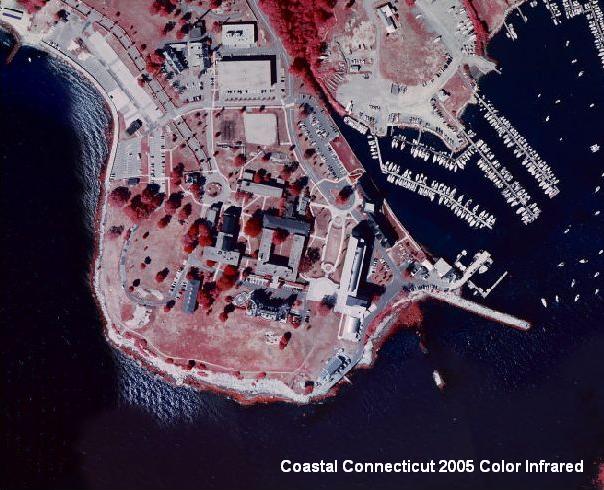
Coastal Connecticut 2005 Color Infrared Orthophotography is an aerial survey of 2005, leaf on, color infrared imagery for the region encompassed by Connecticut municipalities located along the Long Island Sound coastline and along the main stem of the Connecticut River up to the Massachusetts State line. The ground resolution for this imagery is 1 foot (0.305 meter) per image pixel.
Purpose
Orthophotography combines the image characteristics of a photograph with the geometric qualities of a map. It depicts land use, natural resources, vegetation, and other features and characteristics in the immediate shoreline areas of Connecticut during the summer of 2005. This leaf-on, color infrared imagery serves a variety of purposes from observing vegetation and crop condition to supporting identification and mapping of habitat areas through photo interpretation.
The color infrared (CIR) imagery is useful for discerning features such as vegetation that give off a distinct signature in the infrared spectrum.
- Intense bright red typically represent vigorously growing, dense vegetation that produce a large amount of chlorophyll.
- Lighter tones of red, magenta, pinks generally represent vegetation that does not contain as much chlorophyll such as mature stands of evergreens. Agricultural fields nearing the end of the growing season, and dead or unhealthy plants often appear in less intense reds, green, or tan.
- White, blue, green, or tan These colors often represent soils. Darker shades of soil generally indicate higher moisture levels or organic matter. Soil composition also affects soil color appearance, with clayey soils appearing in darker tans and blue-greens, and sandy soils appearing white, gray, or light tan. Crops nearing the end of the growing season, or dead or unhealthy plants will appear in various light tones of red and pink, or greens and tans. Pale or light blue can also represent sediment-laden water. Buildings and manmade materials such as concrete and dry gravel generally appear white to light blue in CIR photos.
- Dark blue to black - Water ranges from shades of blue to black depending on the clarity and depth. Usually, the clearer the water, the darker the color. However, shallow streams will often display the colors associated with the materials in their stream beds. If the stream bed is made of sand, the color will appear white or very light tan due to the high reflective property of sand. Asphalt roads generally appear dark blue to black.
Use Limitations
This is leaf on orthophotography so the tree canopy blocks the ground surface from view and creates shadows that can obscure nearby features. Also, the location and shape of features in other GIS data may not exactly match information shown in the 2005 aerial photography primarily due to differences in spatial accuracy and data collection dates. For example, a stream in the 1:24,000-scale Connecticut Hydrography data from CT DEP may not line up exactly with the watercourse shown in the 2005 aerial photography. Their location and shape are bound to be different because information such as hydrography compiled from older 1:24,000-scale USGS topographic quadrangle maps, lacks the spatial accuracy and is less current than the 2005 orthophotography.
Dataset Information
- Status - Orthophotography covers portions of the following municipalities: Branford, Bridgeport, Chester, Clinton, Cromwell, Darien, Deep River, Derby, East Haddam, East Hartford, East Hampton, East Haven, East Lyme, East Windsor, Enfield, Essex, Fairfield, Glastonbury, Greenwich, Guilford, Groton, Haddam, Hamden, Hartford, Ledyard, Lyme, Madison, Middletown, Milford, Montville, New Haven, New London, Norwalk, Norwich, North Branford, North Haven, Old Lyme, Old Saybrook, Orange, Portland, Preston, Rocky Hill, Shelton, South Windsor, Stamford, Stonington, Stratford, Suffield, West Haven, Waterford, Westbrook, Wethersfield, Westport, Windsor, and Windsor Locks. Includes all offshore islands within the territorial borders of the State of Connecticut including Goose Island and Falkner Island (offshore of Branford); Calf Islands and Great Captain Island (offshore of Greenwich); Norwalk Islands (offshore of Norwalk); Thimble Islands (offshore of Branford); Sandy Point (offshore of Stonington); and all islands in the Connecticut part of Fishers Island Sound.
- Date of Data - Summer 2005. Depending on the area, photography was captured in 2005 on July 12 and 26, August 3 and 25, and September 2 and 10.
- Map Scale and Accuracy - 1:12,000 scale. The ground resolution for this imagery is 1 foot (0.305 meter) per image pixel.
Additional Documentation
- GIS Metadata - Contains technical documentation describing the 2005 Coastal Color Infrared Orthophotography data and the data sources, process steps, and standards used to collect and store this information in a geographic information system (GIS).
Originators
GIS Data Download
- Coastal Connecticut 2005 Color Infrared Orthophotography data is available as a statewide mosaic in File Geodatabase format from DEEP GIS Data.
- Connect GIS and AutoCAD software to this information online using the Ortho 2005 Coast Infrared CT ECO Map Service.