2012 Color and Color Infrared Orthophotography
Description
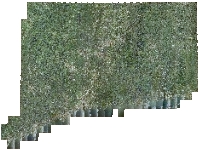
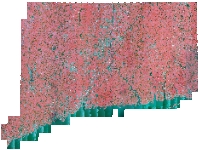
Connecticut 2012 Color and Color Infrared Orthophotography is statewide multispectral digital orthoimagery of March 2012, natural color and color infrared, leaf off, 1 foot (0.30 meter) ground sample distance imagery for Connecticut.
Purpose
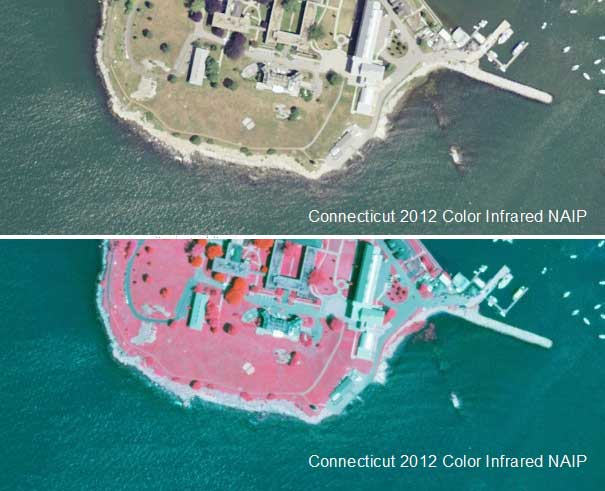
An orthoimage is remotely sensed image data in which displacement of features in the image caused by terrain relief and sensor orientation have been mathematically removed, thus it combines the image characteristics of a photograph with the geometric qualities of a map. The 2012 ortho imagery for Connecticut includes 4 color bands, allowing for the display and analysis in natural color or color infrared, as shown in the nearby example. This leaf-off aerial survey is ideal for XXX. The natural color imagery serves a variety of purposes, from functioning as a cartographic base to XXXX. The color infrared (CIR) imagery is useful for discerning features such as vegetation that give off a distinct signature in the infrared spectrum.
- Intense bright red typically represent vigorously growing, dense vegetation that is producing a large amount of chlorophyll.
- Lighter tones of red, magenta, pinks generally represent vegetation that does not contain as much chlorophyll such as mature stands of evergreens. Agricultural fields nearing the end of the growing season, and dead or unhealthy plants often appear in less intense reds, green, or tan.
- White, blue, green, or tan These colors often represent soils. Darker shades of soil generally indicate higher moisture levels or organic matter. Soil composition also affects soil color appearance, with clayey soils appearing in darker tans and blue-greens, and sandy soils appearing white, gray, or light tan. Crops nearing the end of the growing season, or dead or unhealthy plants will appear in various light tones of red and pink, or greens and tans. Pale or light blue can also represent sediment-laden water. Buildings and manmade materials such as concrete and dry gravel generally appear white to light blue in CIR photos.
- Dark blue to black - Water ranges from shades of blue to black depending on the clarity and depth. Usually, the clearer the water, the darker the color. However, shallow streams will often display the colors associated with the materials in their stream beds. If the stream bed is made of sand, the color will appear white or very light tan due to the high reflective property of sand. Asphalt roads generally appear dark blue to black.
Use Limitations
This statewide mosaic of 2012 orthophotography is not color balanced so tonal imbalances between individual input images are not corrected. As shown in the nearby example, the range and intensity of colors varies depending on the area viewed. For example, surface water bodies and and trees in the natural color imagery appear in different intensities of blue and green across the state. Because the 2012 aerial photography was taken during the peak agricultural growing seaon, the tree canopy blocks the ground surface from view and creates shadows that also obscure nearby features. Also, the location and shape of features in other GIS data may not exactly match information shown in the 2012 aerial photography primarily due to differences in spatial accuracy and data collection dates. For example, a stream in the 1:24,000-scale Connecticut Hydrography data from CT DEP may not line up exactly with the watercourse shown in the 2008 aerial photography. Their location and shape are bound to be different because information such as hydrography compiled from older 1:24,000-scale USGS topographic quadrangle maps, lacks the spatial accuracy of and is less current than the 2012 orthophotography.
Dataset Information
- Status - Orthophotography covers the State of Connecticut.
- Date of Data - March 2012. Depending on the area, photography was captured between March 18 and March 30.
- Map Scale and Accuracy - The ground resolution for this imagery is 3.39 feet (1 meter) per image pixel.
Additional Documentation
- GIS Metadata - Contains technical documentation describing the 2012 NAIP Color and Color Infrared Orthophotography data and the data sources, process steps, and standards used to collect and store this information in a geographic information system (GIS).
Originators
GIS Data Download
- Connecticut 2012 NAIP Orthophotography data is available as a statewide mosaic in File Geodatabase format from DEEP GIS Data.
- Connect GIS and AutoCAD software to this information online using the Ortho 2012 4Band NAIP CT ECO Map Service.