 Add the Elevation Layers to ArcMap
![]() Click the Add Data button.
Click the Add Data button.
In the Look in: box, scroll down to GIS Servers and double-click on Add ArcGIS Server.
Choose Use GIS services and click Next >

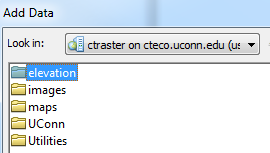 In the GIS Servers list, ctraster on cteco.uconn.edu (user) should be listed.
 For information about each layer, see the Elevation category on the Map Services page.
Once the layers are in ArcMap, there is a lot you can do with them.
Access these options through Layer Properties (right-click over the Layer in the Table of Contents and select Properties from the menu).
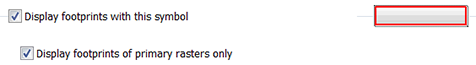 The Display tab contains a checkbox to display footprints. The mosaic dataset is a virtual mosaic, not a true one. Check the box to see the footprint of each tiles that is part of the mosaic dataset. The second checkbox is for viewing only primary rasters. Primary rasters are the original tiles. The mosaic dataset also contains overviews, or images created to display the information quickly at different scales. The overviews are not primary rasters and their footprints will not be displayed if the second box is checked.
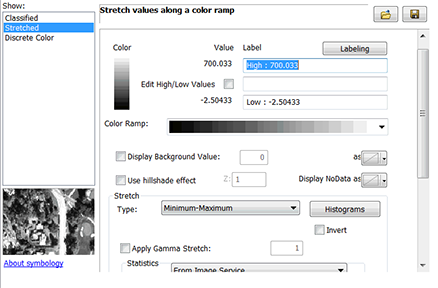
Options on the symbology tab vary by dataset. Regardless, the symbology tab contains many different ways to change the way the data is displayed. First, notice the options under Show:. Stretched is what is used initially, but Classified, Discrete Color and RGB Composite (if it is a colored layer) are also options.
The color ramp can be changed, as well as the high and low values, if there is a background value (usually 0), and what type of stretch to apply.
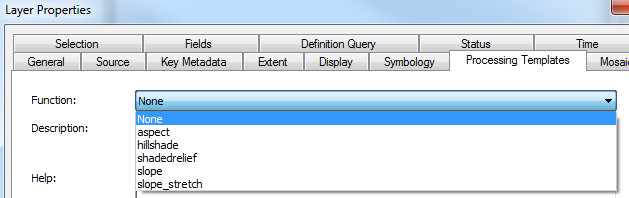
If the image service ends in a date, it is an elevation dataset (meaning that it is NOT a reference mosaic dataset with a function already applied like slope, hillshade, etc.). In Layer Properties, select the Processing Templates tab. Choose one to apply that function to the layer.